ANNOUNCEMENT: We held a successful workshop on “Advancing Tools for Modeling, Forecasting and Managing for Vibrio spp. in the North East Region” at the UCONN Avery Point Campus on November 17-18, 2015. We are currently working on the workshop report. Please visit the meeting website for more information: http://cprime.uconn.edu/meeting.
Vibrio parahaemolyticus (Vp) is a growing threat to producing safe seafood from Connecticut (CT) shellfish beds. Vp is a marine bacterium that occurs naturally in brackish and salt-water environments, and may be found in higher concentrations from April through October when coastal waters are warm. Consumers may be exposed to these pathogenic bacteria by eating raw or undercooked shellfish, including oysters, clams, lobsters, and crabs (CDC 2013). Mild to moderate gastrointestinal illness can result. In 2013, Norwalk, Darien, and Westport areas were closed from early August to mid-September due to confirmed Vp-related illnesses linked to oyster consumption from these areas. David Carey, CT Bureau of Aquaculture Director, noted in 2013 “The Vibrio outbreak and closure and recall is a tremendous hit to Connecticut, as the reason many states were purchasing our oysters in the months of June, July and August” was “to avoid exposure to Vibrio” (Zaretsky 2013).
This project, funded by Connecticut Sea Grant, will analyze previously collected and new observations to establish how Vp levels vary with Long Island Sound (LIS) water properties. This effort will apply the observations, laboratory results, and models to understand and predict Vp outbreaks in LIS. The principal investigators are Mike Whitney (UCONN Marine Sciences), Evan Ward (UCONN Marine Sciences), and Kristin DeRosia-Banick (CT Bureau of Aquaculture).
The main question this research project is: How do the spatial and temporal patterns in water temperature and salinity over Norwalk commercial shellfish areas influence Vibrio parahaemolyticus concentrations in oysters? The Norwalk area was selected because of its commercial importance and past occurrence of Vp outbreaks. The inner island area associated with illness is very diverse, comprised of shallow water areas, deep water pockets, sand bars, rocky outcroppings, and a significant island complex.
The research will test the following hypotheses:
- Shellfish in deeper offshore growing areas have lower Vp levels than nearshore areas due to lower near-bottom temperatures.
- The time-lag between Vp counts in water and oyster tissue varies with Vp concentration due to factors including changes in the uptake and depuration by oysters, and proliferation in oyster tissues.
- A linear regression model (following FDA methods) linking Vp counts in shellfish to water temperature and salinity values supplied by a hydrodynamic model will show statistically significant agreement with observations in LIS growing areas.
- Using an ultrahigh-resolution hydrodynamic/Vp model for the Norwalk area (through representation of fine-scale bathymetry, islands, flow patterns, and water properties) will significantly improve Vp model agreement with observations. An important factor in causing the 2012 high-Vp event is the anomalously high temperatures from winter to midsummer throughout LIS while the event in 2013 is linked to locally higher temperatures and salinities due to circulation shifts and lower river flow in western LIS.
Observations, experiments, and models will be combined to answer the research question for 2012-2016, test hypotheses, and inform Vp management.
Temperatures at NOAA Coastal Stations
NOAA has several coastal stations collecting air and water temperatures in LIS. Temperatures at these coastal stations are not the same as they are farther offshore, but they do give useful information about temperature trends. The graphs below show air and water temperatures for the NOAA station in Bridgeport, CT. More than a decade of data is available at this station; the record average and record extremes for each day are shown along with the recent times series of hourly and daily-averaged temperatures.


Vp Prediction System Development
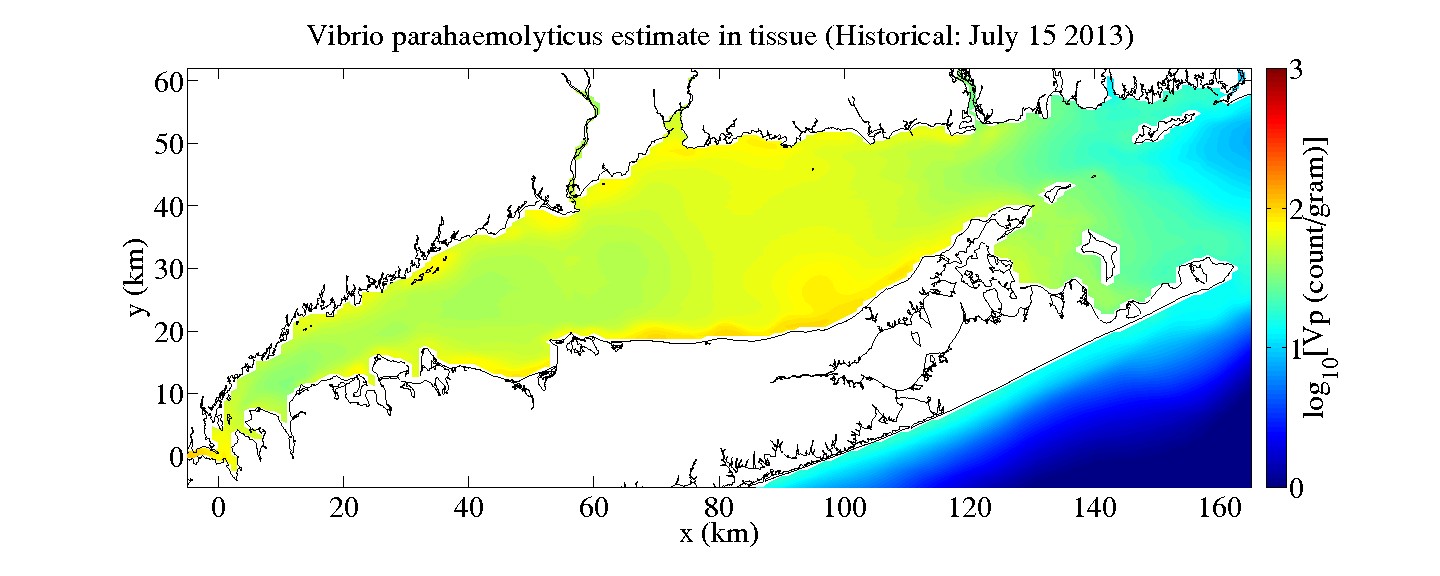
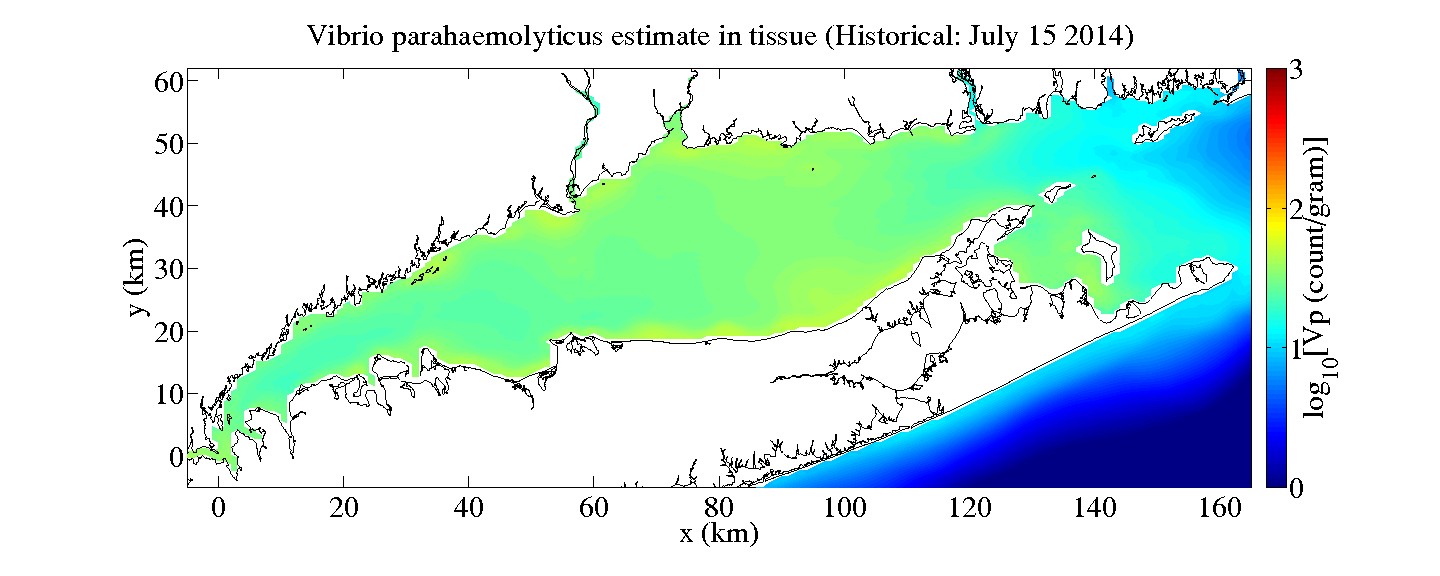
We have begun development of a Vp prediction system for shellfish in LIS. At this stage, the results below should be viewed as demonstrating prediction techniques. It is unclear whether these results are representative of actual conditions; further analysis and comparison with observations are needed. These demonstration results are not intended for use in management decisions or for informing shellfish-related issues. This prediction system involves the following steps:
1) Daily sea-surface temperature (SST) data are acquired from the G1SST product (from the NASA Jet Propulsion Laboratory) that includes observations from satellites. The prior week (7 days) of SST are averaged together to construct the weekly-averaged surface temperature field throughout LIS.

2) Previous results from a hydrodynamic model of LIS and adjacent coastal waters (run by Mike Whitney’s research group) are analyzed to determine the top-to-bottom temperature differences (ΔT) at locations throughout LIS. Four years of model results (2009-2012) are averaged together to determine the average annual cycle of ΔT at each location. Temperature differences are smallest during the winter and largest during the summer; the differences typically are larger for deeper areas. The ΔT estimate from the model-based average annual cycle then is subtracted from the weekly-averaged surface temperatures to produce an estimate of the bottom temperature field.

3) The same model results used for the average annual cycle of ΔT are used to construct an average annual cycle of bottom salinity at locations throughout the LIS. The bottom temperature and salinity fields are the input data for the pre-harvest model component of the FDA Quantitative Risk Assessment. The results yield preliminary predictions of Vp counts in pre-harvest oyster tissue.

Many shellfish activities occur in a relatively narrow band along the CT coast. To look at conditions averaged over large spatial areas, a coastal region was defined as all areas extending out to 12 m deep (approximately 40 feet deep) and then split into a western and eastern section (with the dividing line just east of New Haven Harbor at x=80 km). The spatial average results for the western CT coastal area are shown in the graphs below.


This same system can be applied to recent historical dates to study past events. Example Vp results from two dates in recent years are shown below.

